Understanding Pulse Oximeter Readings Charts (PDF)
Pulse oximeter readings charts, often in PDF format, are crucial for interpreting SpO2 levels and pulse rates, aiding in vital patient assessment and monitoring practices.
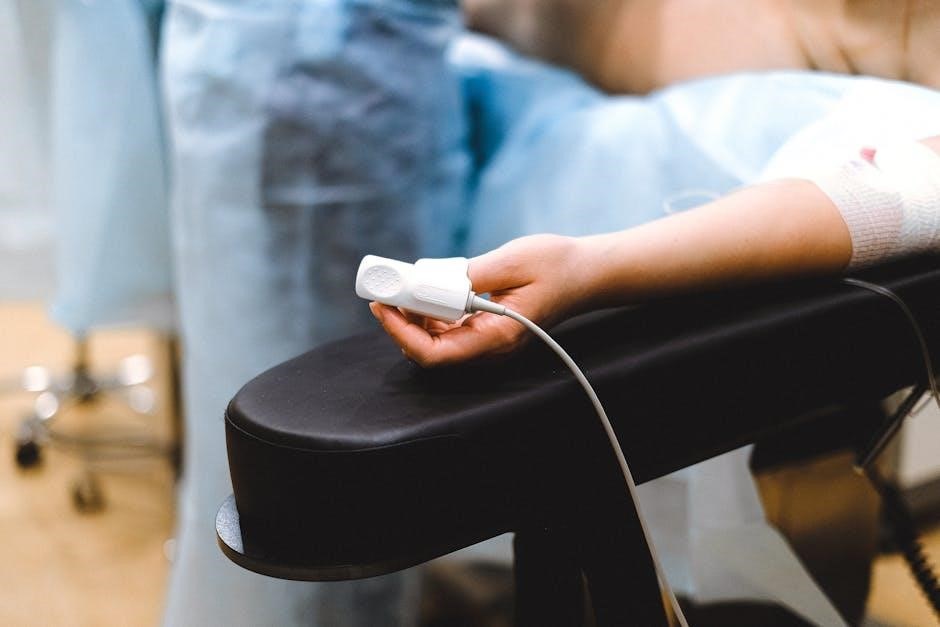
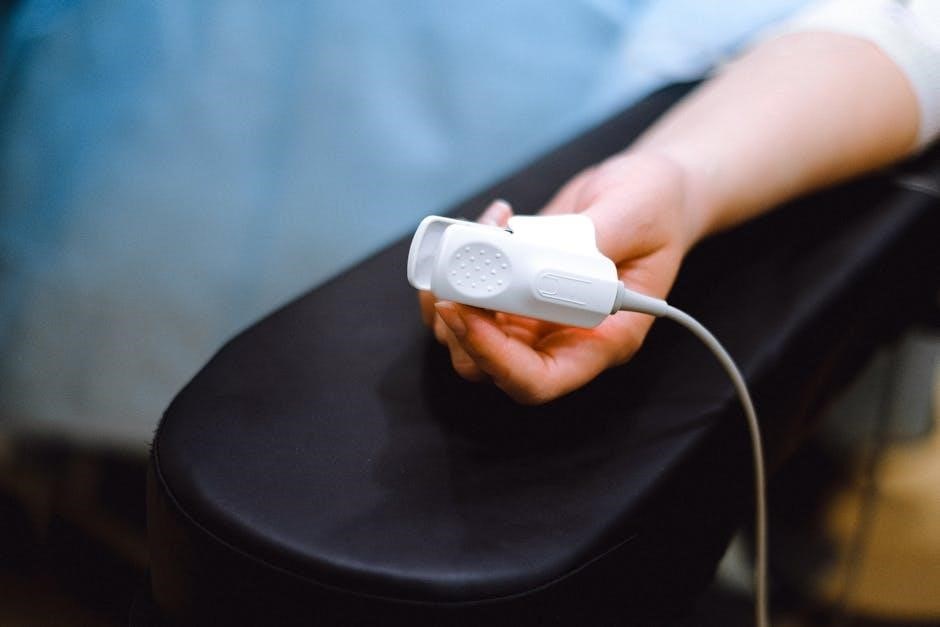
What is a Pulse Oximeter?
A pulse oximeter is a small, non-invasive device that measures the oxygen saturation level in your blood, and your pulse rate. Invented by Dr. Takuo Aoyagi in 1974, it clips onto a fingertip, earlobe, or toe. It’s a vital tool for assessing a patient’s respiratory status, quickly indicating how well oxygen is being delivered throughout the body.
The device works by shining beams of light through the skin and measuring the amount of light absorbed by red blood cells. This allows it to determine the percentage of hemoglobin carrying oxygen. Nurses rely on pulse oximeters for accurate readings, understanding that factors can influence results. Accessing reliable pulse oximeter readings charts (PDF) is essential for proper interpretation and informed clinical decisions, especially when monitoring conditions like asthma, COPD, or tracking oxygen levels during illnesses like COVID-19.
How Pulse Oximetry Works: The Science Behind the Readings
Pulse oximetry leverages the differing light absorption characteristics of oxygenated and deoxygenated hemoglobin. The device emits light beams of two wavelengths – red and infrared – through a pulsating tissue, like a fingertip. Oxygenated hemoglobin absorbs more infrared light, while deoxygenated hemoglobin absorbs more red light.
By measuring the ratio of these absorptions, the pulse oximeter calculates SpO2, or oxygen saturation. This process is non-invasive and provides a quick assessment of respiratory function. Understanding this science is crucial when interpreting pulse oximeter readings charts (PDF). However, it’s important to remember that accuracy can be affected by factors like skin pigmentation and motion. Reliable charts aid in recognizing normal ranges and identifying potential issues, supporting effective patient care and monitoring.
Normal Pulse Oximeter Readings: A Comprehensive Chart

A comprehensive pulse oximeter readings chart (PDF) typically defines normal SpO2 levels as falling between 95% and 100% for most healthy individuals. However, acceptable ranges can vary slightly. Readings between 90% and 94% suggest mild hypoxemia, potentially requiring intervention. Values below 90% indicate significant oxygen deprivation and demand immediate medical attention.
Charts also detail normal pulse rate ranges, generally between 60 and 100 beats per minute for adults. These PDF charts often categorize readings as normal, elevated (tachycardia), or low (bradycardia). It’s vital to consult a chart alongside clinical assessment, as individual factors influence these values. Understanding these ranges, presented clearly in a PDF, is essential for accurate interpretation and timely response.
Pulse Oximeter Readings by Age Group
Pulse oximeter readings chart PDFs frequently highlight age-specific norms, recognizing that acceptable SpO2 levels differ across the lifespan. Newborns generally have slightly lower normal ranges, typically between 90% and 95%, due to differing hemoglobin characteristics. Infants and children usually align with adult norms of 95-100%, though slight variations exist.
These PDF charts often present data in tabular format, clearly outlining expected ranges for each age bracket. Understanding these nuances is crucial, as applying adult standards to pediatric patients can lead to misinterpretation. A detailed PDF resource will specify these age-related differences, aiding healthcare professionals in accurate assessment and appropriate intervention when deviations occur. Always refer to a reliable, age-stratified chart.
Understanding SpO2 Levels: Detailed Breakdown
Pulse oximeter readings chart PDFs provide a detailed breakdown of SpO2 (peripheral oxygen saturation) levels, categorizing them for easy interpretation. Generally, a reading of 95% to 100% is considered normal, indicating adequate oxygen in the blood. Levels between 90% and 94% suggest mild hypoxemia, potentially requiring intervention.
A PDF chart will typically illustrate that readings below 90% signify significant hypoxemia, demanding immediate medical attention. These charts often include color-coded zones – green for normal, yellow for concerning, and red for critical. Understanding these thresholds, as presented in a comprehensive PDF, is vital for timely clinical decision-making and effective patient care. Accurate interpretation relies on referencing a reliable, detailed chart.
Factors Affecting Pulse Oximeter Accuracy
Pulse oximeter readings chart PDFs often include disclaimers regarding factors impacting accuracy. A significant concern highlighted in recent reports is that darker skin pigmentation can lead to less accurate readings, as noted by the FDA. This is due to melanin absorbing light, potentially interfering with the device’s measurements.
Furthermore, motion artifact – movement during measurement – can disrupt the signal, leading to inaccurate SpO2 values. Poor circulation, especially in extremities, also compromises accuracy. A PDF chart won’t show these limitations directly, but understanding them is crucial when interpreting results. Always consider these variables when using a pulse oximeter and referencing a PDF guide.
Skin Pigmentation and Accuracy Concerns
Pulse oximeter readings chart PDFs don’t typically detail the impact of skin pigmentation, but it’s a critical factor. Extensive research demonstrates that pulse oximeters can yield less accurate readings for individuals with darker skin tones. This stems from melanin, the pigment responsible for skin color, absorbing light at wavelengths used by the device.
Consequently, the oximeter may overestimate oxygen saturation levels in these cases. The FDA is currently addressing this issue, proposing guidance to improve accuracy across all skin tones. When reviewing a PDF chart, remember this potential bias and consider it alongside clinical assessment. Understanding this limitation is vital for equitable healthcare and accurate interpretation of results.
Motion Artifact and Reading Interference

Pulse oximeter readings chart PDFs rarely explicitly address motion artifact, yet it’s a significant source of inaccuracy. Movement, even slight tremors, can disrupt the light signal received by the sensor, leading to fluctuating and unreliable readings. This interference is because the device relies on a consistent light path through the tissue.
When interpreting a PDF chart, consider if the patient was still during measurement. Excessive movement can create false low readings, potentially triggering unnecessary alarm or intervention. Nurses must be aware of this and ensure proper sensor placement and patient cooperation. Minimizing movement is crucial for obtaining a valid SpO2 assessment and accurate data interpretation.
Poor Circulation and its Impact

Pulse oximeter readings chart PDFs often don’t detail the impact of poor circulation, but it’s a critical consideration. Reduced blood flow to the extremities, whether due to conditions like peripheral artery disease or simply cold temperatures, can significantly affect accuracy. The device relies on arterial blood flow to measure oxygen saturation.

When reviewing a PDF chart, remember that vasoconstriction diminishes the pulse signal, potentially leading to falsely low SpO2 readings. Ensure the sensor is placed on a well-perfused site, ideally a finger or earlobe with adequate warmth and blood flow. Recognizing the influence of circulation is vital for correct interpretation and avoiding misdiagnosis, especially in patients with compromised vascular health.
Decoding a Pulse Oximeter Readings Chart (PDF)
Pulse oximeter readings chart PDFs typically present SpO2 levels alongside corresponding pulse rate data. Understanding the chart’s layout is key; most charts categorize SpO2 into ranges – normal, low, and high – with color-coded indicators for quick assessment. A PDF may also include typical values based on age groups, offering a comparative benchmark.
When analyzing a chart, note the units used (usually percentage for SpO2 and beats per minute for pulse rate). Pay attention to any accompanying notes regarding potential inaccuracies or influencing factors. Effective decoding involves correlating SpO2 and pulse rate; for example, a low SpO2 with an elevated pulse rate suggests respiratory distress. Always refer to the chart’s specific guidelines for accurate interpretation.
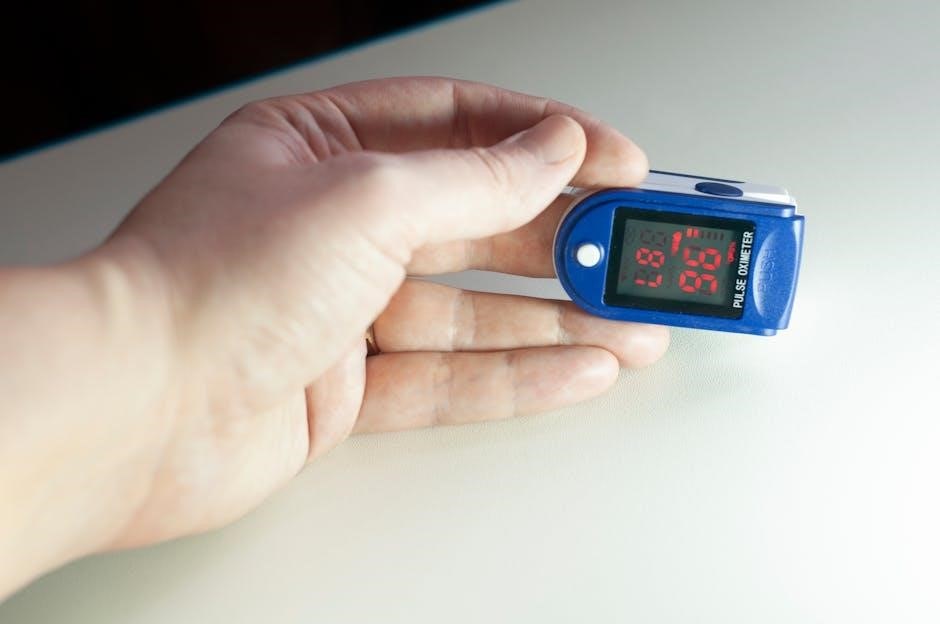
Common Pulse Oximeter Readings and Their Meanings
Pulse oximeter readings charts reveal crucial health insights. Generally, a SpO2 reading of 95-100% is considered normal, indicating sufficient oxygen in the blood. Readings between 90-94% suggest mild hypoxemia, potentially requiring intervention. Values below 90% signify significant oxygen deficiency, demanding immediate medical attention.
Alongside SpO2, pulse rate is vital; A normal resting pulse rate typically falls between 60-100 bpm. Elevated rates can indicate stress, dehydration, or underlying medical conditions. Conversely, a low pulse rate might suggest excellent cardiovascular fitness or, in some cases, a medical issue. PDF charts often correlate these readings, helping identify potential problems. Remember, context matters; individual variations and medical history are crucial for accurate interpretation.
Low Oxygen Saturation (Hypoxemia): Causes and Symptoms
Pulse oximeter readings charts help identify hypoxemia – dangerously low blood oxygen. Numerous factors can cause this, including respiratory illnesses like pneumonia or asthma, and conditions affecting lung function, such as COPD. Heart problems, and even altitude sickness can also contribute.
Symptoms of hypoxemia range in severity. Mild cases may present as shortness of breath or increased heart rate. More severe hypoxemia can cause confusion, restlessness, and bluish discoloration of the skin (cyanosis). PDF resources often detail these symptoms alongside corresponding SpO2 levels. Prompt medical evaluation is crucial if a pulse oximeter consistently shows readings below 90%, as untreated hypoxemia can lead to organ damage and be life-threatening.
High Oxygen Saturation (Hyperoxemia): Potential Issues
While generally less concerning than hypoxemia, consistently high oxygen saturation – hyperoxemia – indicated by pulse oximeter readings charts, isn’t always beneficial. Prolonged exposure to elevated oxygen levels can lead to oxygen toxicity, causing damage to the lungs and central nervous system. This is particularly relevant for patients receiving supplemental oxygen therapy.
PDF guides on interpreting readings often highlight that hyperoxemia can suppress the body’s natural drive to breathe, potentially leading to carbon dioxide retention. Certain medical conditions, and even improper oxygen administration, can contribute. A pulse oximeter reading consistently above 99% warrants medical attention to determine the underlying cause and adjust treatment accordingly, preventing potential complications.
Pulse Rate vs. Oxygen Saturation: What’s the Difference?
Pulse oximeter readings charts display two key vital signs: oxygen saturation (SpO2) and pulse rate. While both are crucial, they measure different aspects of physiological function. SpO2 indicates the percentage of hemoglobin carrying oxygen in the blood, reflecting respiratory efficiency. Pulse rate, measured in beats per minute, represents the heart’s contractions, indicating cardiovascular function.
Understanding this distinction is vital when interpreting PDF guides. A normal SpO2 reading doesn’t guarantee a healthy pulse rate, and vice versa. For example, a patient could have adequate oxygen saturation but a rapid pulse due to fever or dehydration. Pulse oximeters assess these independently, providing a more comprehensive picture of a patient’s overall health status.
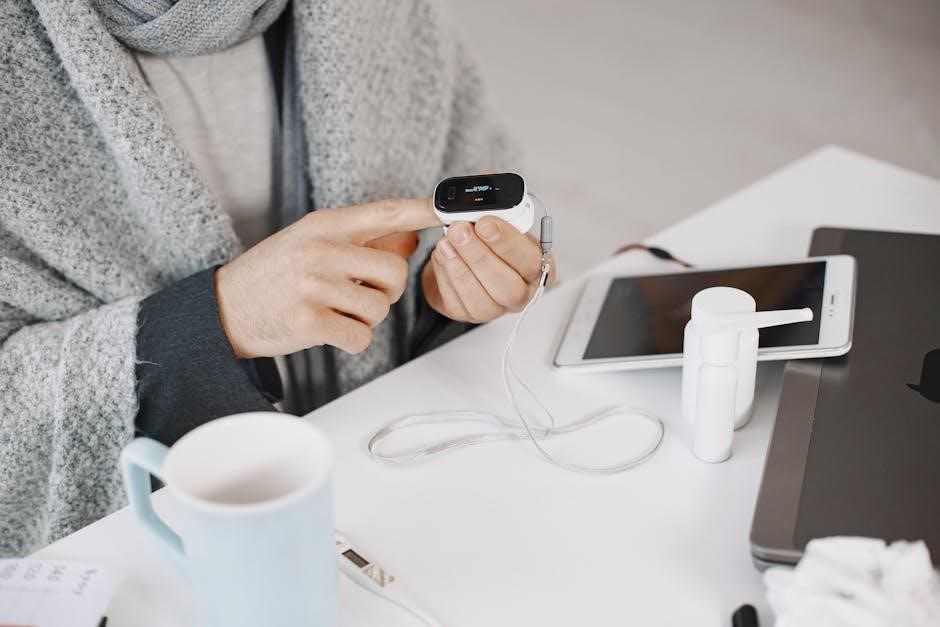
Using Pulse Oximeters at Home: Best Practices
Pulse oximeter readings charts become particularly relevant for at-home monitoring. Ensure the device is used correctly for accurate results. Warm hands are essential, as poor circulation impacts readings. Follow the PDF guide’s instructions for proper finger placement, avoiding nail polish or artificial nails.
Record readings consistently, noting the time and any associated symptoms; Share this data with your healthcare provider, especially when tracking conditions like COVID-19 or sleep apnea. Remember, home pulse oximetry isn’t a substitute for medical advice. Understanding normal ranges, as detailed in pulse oximeter readings charts, empowers informed self-monitoring, but professional evaluation remains crucial.
Interpreting Pulse Oximeter Readings in Different Medical Conditions
Pulse oximeter readings charts are vital when managing specific health conditions. For asthma and COPD, monitoring SpO2 helps assess treatment effectiveness and detect exacerbations. During COVID-19, tracking oxygen levels at home, guided by a PDF chart, can indicate disease progression.
In sleep apnea screening, readings taken during sleep, alongside a detailed chart, can reveal intermittent drops in oxygen saturation. However, remember that accuracy can be affected by factors like skin pigmentation. Always correlate pulse oximetry data with clinical symptoms and consult a healthcare professional for accurate diagnosis and treatment plans, utilizing the PDF as a supplemental tool.
Asthma and COPD Monitoring
Pulse oximeter readings charts (PDF) are invaluable tools for individuals managing asthma and Chronic Obstructive Pulmonary Disease (COPD). Regular monitoring helps track respiratory function and response to medication. A PDF chart allows patients and clinicians to identify trends in SpO2 levels, indicating potential airway obstruction or worsening symptoms.
During asthma attacks or COPD exacerbations, frequent readings, documented using a PDF format, can guide treatment adjustments. Maintaining a record helps determine if bronchodilators are effectively improving oxygenation. However, it’s crucial to remember that pulse oximetry is a supplemental assessment; clinical evaluation remains paramount. A clear, accessible PDF chart empowers patients to participate actively in their care.
COVID-19 and Oxygen Level Tracking
Pulse oximeter readings charts (PDF) became essential during the COVID-19 pandemic for home monitoring of oxygen saturation levels. Asymptomatic or mildly symptomatic individuals used them to detect “silent hypoxia,” a dangerous condition where oxygen levels drop without noticeable shortness of breath. A readily available PDF chart facilitated tracking SpO2 trends over time, alerting individuals to seek medical attention when levels fell below recommended thresholds.
The ability to monitor at home, using data recorded on a PDF, helped alleviate strain on healthcare systems. However, awareness of potential inaccuracies, particularly in individuals with darker skin tones, was crucial. PDF charts should be used in conjunction with other symptom monitoring and medical advice, not as a sole diagnostic tool.
Sleep Apnea Screening
Pulse oximeter readings charts (PDF) can offer a preliminary indication of potential sleep apnea, though they are not a definitive diagnostic tool. During sleep, individuals with sleep apnea experience repeated pauses in breathing, leading to intermittent drops in blood oxygen levels. A PDF chart tracking SpO2 throughout the night may reveal these desaturations, presenting a pattern of fluctuating oxygen levels.
However, it’s vital to understand that many factors can cause temporary dips in oxygen saturation during sleep. A comprehensive sleep study, involving polysomnography, is necessary for an accurate diagnosis. A PDF generated from home oximetry can be a useful supplement to discuss with a healthcare professional, providing valuable data points for further evaluation and treatment planning.
Finding Reliable Pulse Oximeter Readings Chart PDFs
Locating trustworthy pulse oximeter readings charts in PDF format requires careful consideration of the source. Reputable medical institutions, such as the American Lung Association or the National Institutes of Health (NIH), often provide downloadable PDF charts for informational purposes. University hospital websites and professional medical societies are also excellent resources.
When downloading a PDF, verify the chart’s origin and date of publication to ensure it reflects current medical guidelines. Avoid charts from unknown or commercially driven websites lacking clear medical oversight. Look for PDFs that clearly define SpO2 ranges, age-specific considerations, and potential influencing factors. Always discuss any readings with a healthcare professional for accurate interpretation and personalized advice.
The History of Pulse Oximetry: From Invention to Modern Use
Pulse oximetry’s origins trace back to 1974, with Dr. Takuo Aoyagi, a Japanese bioengineer, pioneering the initial invention. His work leveraged the differing light absorption characteristics of hemoglobin at various wavelengths – a foundational principle still utilized today. Early devices were bulky and complex, primarily for research purposes.

Over subsequent decades, advancements in technology led to smaller, more portable, and user-friendly pulse oximeters. The development of readings charts, initially as reference tables and later as easily accessible PDFs, aided in clinical interpretation. Today, pulse oximetry is an indispensable tool in hospitals, emergency medicine, and increasingly, for home health monitoring, demonstrating a remarkable evolution from its humble beginnings.
Future Developments in Pulse Oximetry Technology
Ongoing research focuses on enhancing pulse oximeter accuracy, particularly addressing disparities in readings for individuals with diverse skin pigmentation. Expect more sophisticated algorithms and sensor technologies to mitigate these concerns, potentially integrated into improved pulse oximeter readings charts and accessible PDF guides.
Further innovations may include wearable, continuous monitoring devices, and integration with telehealth platforms for remote patient care. Development of multi-parameter sensors, combining pulse oximetry with other vital signs, is also anticipated; The future promises more personalized and precise oxygen saturation monitoring, alongside readily available, updated PDF resources for accurate interpretation.